Dashboards
When you are working on lots of different things, it is nice to get an overview of everything you have to do. In the desktop version it is possible to display multiple views in one window. Without constantly adjusting it after re-starting the app!
You can see the hierarchical Outline and simple To-Do side by side, drag&drop tasks from Inbox to where they should be in a hierarchy, track projects and see high-level goals, and more. Dashboards help you stay updated on what is happening in multiple views, and they are especially handy if you use multiple screens.
How to create a Dashboard
To create a new dashboard go to menu View → New Dashboard
A new dashboard opens in Edit mode. Here you can click to add more columns and rows and change the view displayed.

In dashboards you can display any view from your list of views. If you need to add filters to tasks, hide/show completed tasks, you can do it in the main MLO window. Just apply the required filters and save that view — the changes will be reflected in the view in the dashboard.
Tip. Here you can find a detailed instruction on how to create and save a custom view.
How to manage Dashboards
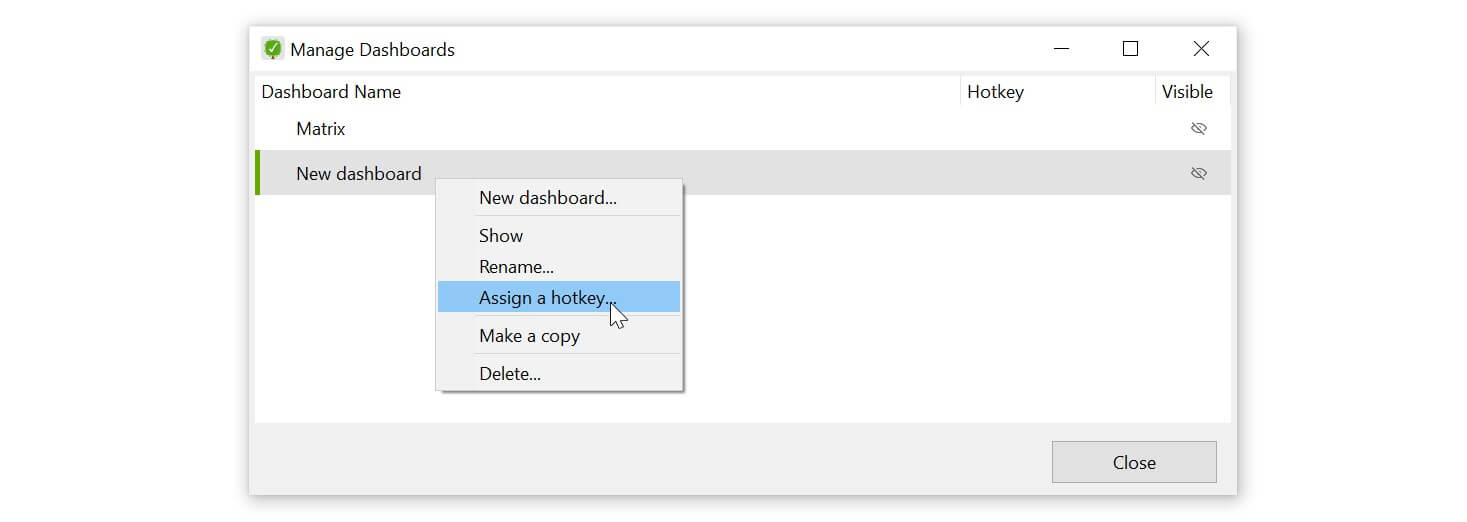
You can find all your dashboards in menu View → Manage dashboards. Click the ‘eye’ icon next to the dashboard(s) you want to open.
Assign hotkey
You can assign hotkeys to a dashboard to quickly open it.
Tip. If you want your dashboards to open immediately when you start MLO, just don't close them when you exit the program. Close the program window.
Add new task
Use hotkeys to create tasks in a view inside the dashboard:
Ctrl Nto add a new taskShift Ctrl Nto add a subtask
Switch to the main window by double clicking
In dashboard, if you double-click a task which has no subtasks, it will bring you to the main window where you can view and edit all its properties.
Drag&Drop tasks between views
You would typically need it for moving tasks out of Inbox. Just select the tasks and drag&drop them to the required position in your list.
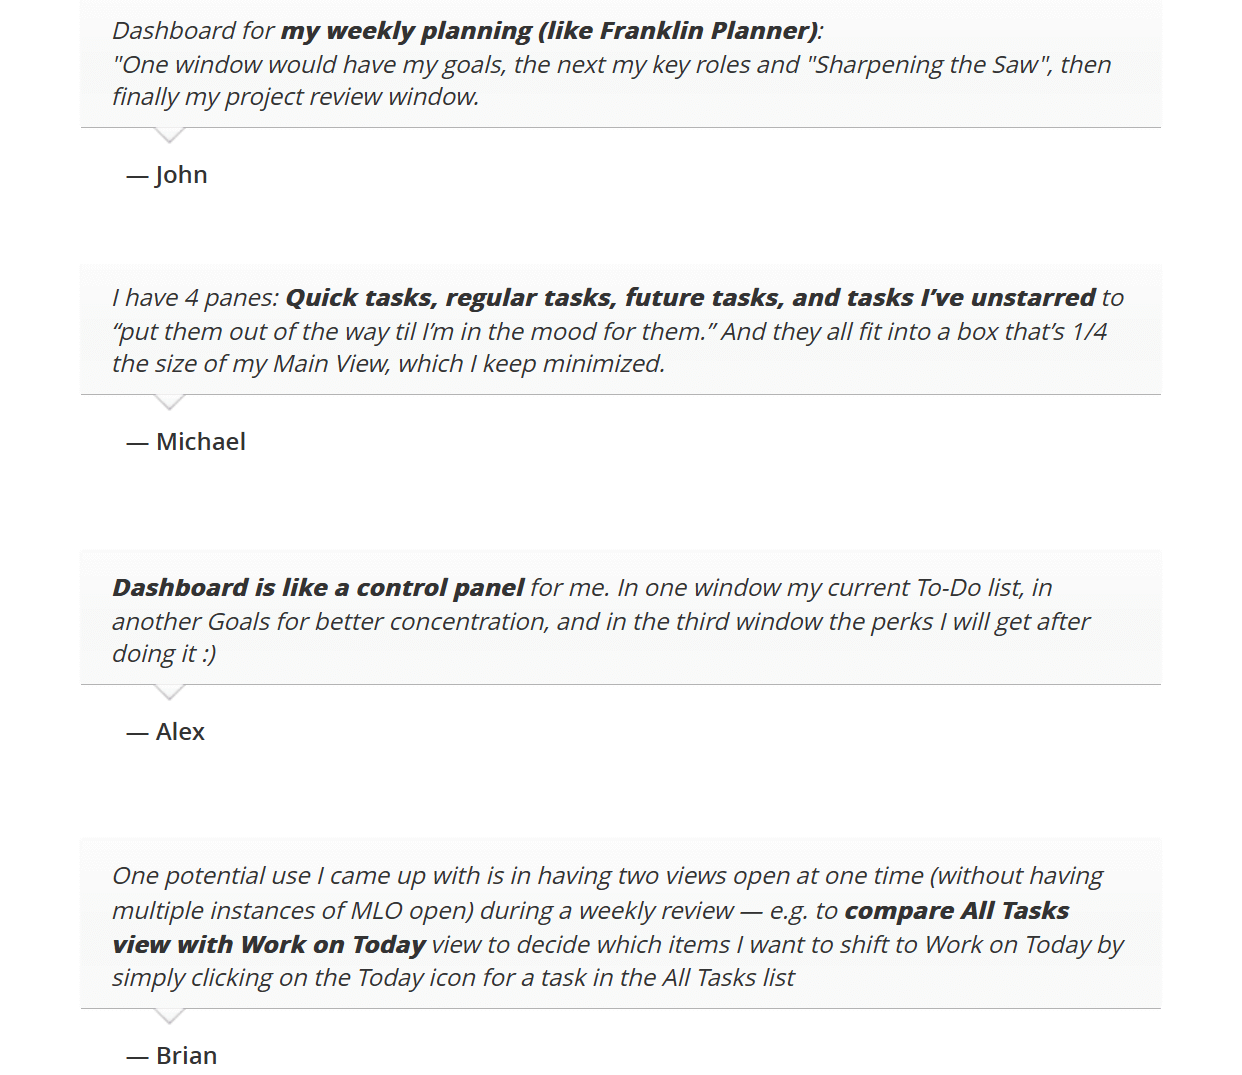
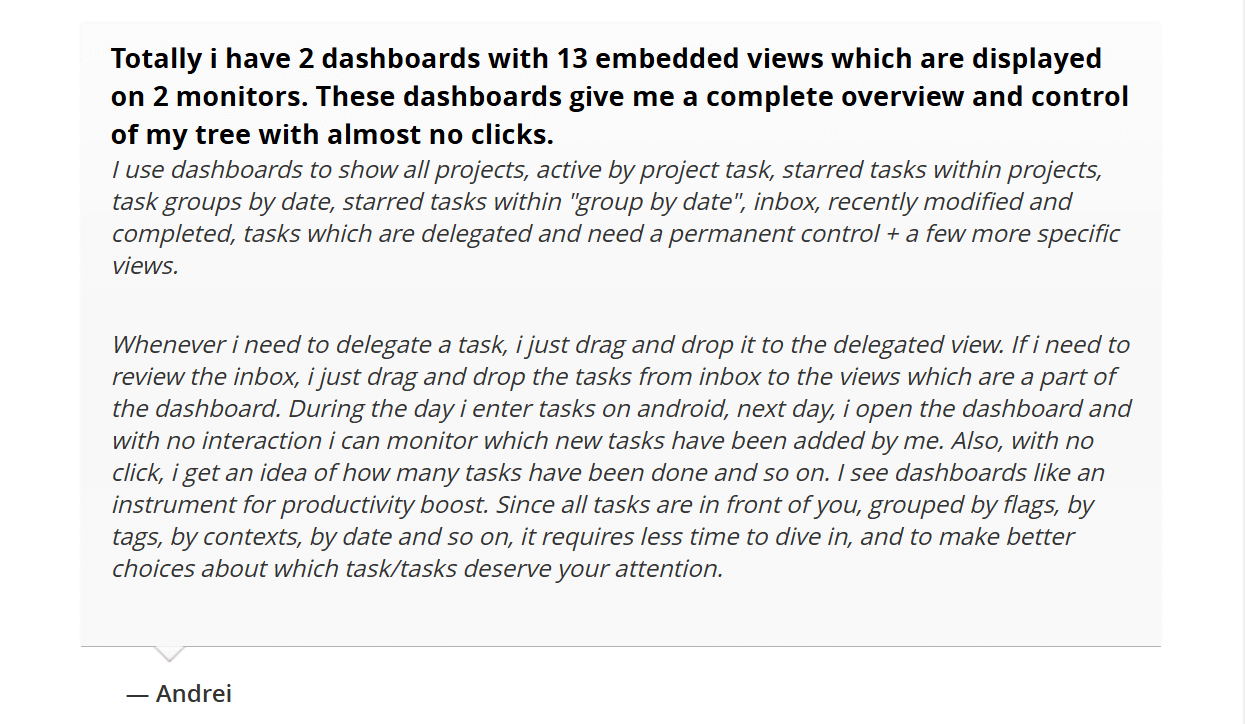
Use Cases
As with most other features in MLO, you can tweak and tune dashboards to what you need. We have collected some feedback to give you more ideas on how you can use dashboards:
Calendar Dashboard
Another use case shared by MLO users is the "Calendar dashboard." The idea is to display tasks for each day of the week in a column, like this:
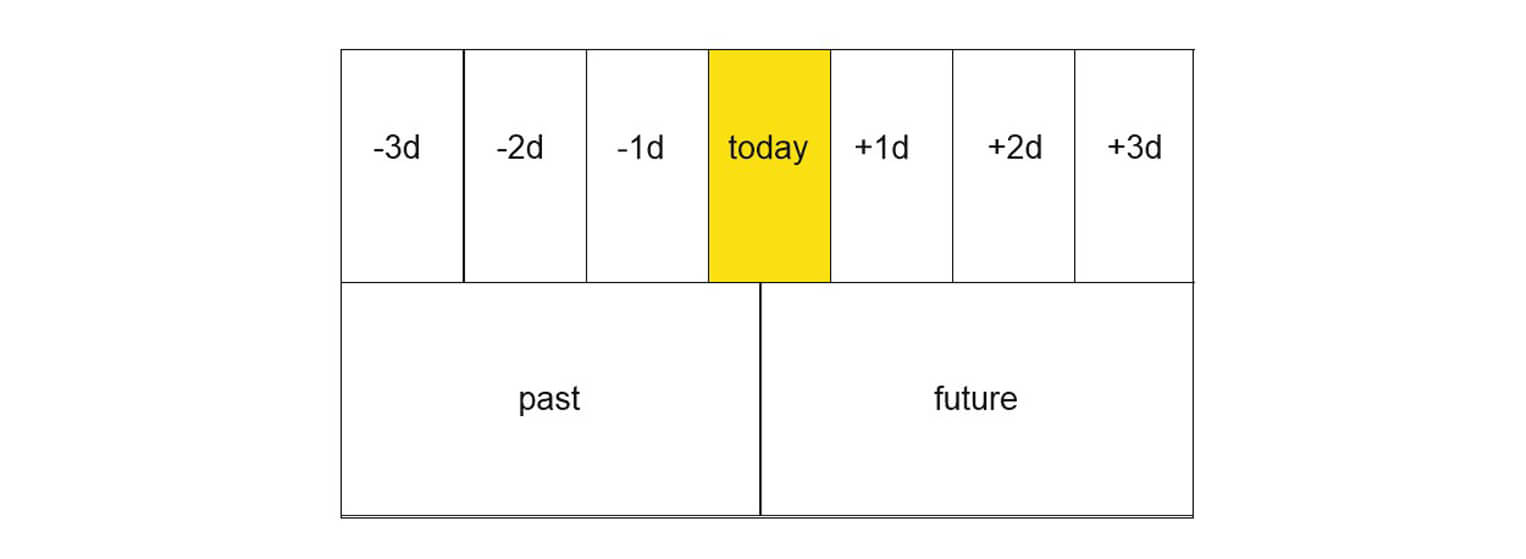
Tip. If you want to add several columns full-height to a dashboard that already has rows, just create another dashboard and place next to the first one.
Kanban board
You can also create a Kanban board using dashboards. They weren't designed for that, so this was a nice surprise to us from our beta testers!
No magic here though. You definitely need to take some time to set up the views you want to open in each column, but then the dashboard works pretty well. You can move tasks from one column to another by dragging&dropping them to the group name — the corresponding flag will be assigned automatically.
Here is our example on how to manage the 'Kitchen Project'. The view in the columns 'To Do', 'Doing' and 'Waiting' shows tasks filtered by flag. 'Done' shows completed tasks, and 'Backlog' shows tasks that have no flag.

Tip. For your convenience, we've saved this configuration. You can download and import the views, flags and dashboard to your data file in MLO:
To import views right-click in the Views pane → Import → Select the .mfv file.
To import flags go to menu File → Import → Select the .xml file → Open → Select 'Flags'.
To import a dashboard go to menu File → Import → Select the .xml file → Open → Select 'Dashboards'.
Another example of using Kanban is managing the delegated tasks: the first view - John's tasks, second view - Mathew's tasks, etc.
Eisenhower matrix
Similarly, you can create a dashboard that displays the urgent-important matrix, four quadrants. This tool helps you divide your tasks into four categories: the tasks you'll do first, the tasks you'll schedule for later, the tasks you'll delegate, and the tasks you'll declutter.

In our example, we used the following filters:
- Important are tasks with importance more than normal
- Urgent are tasks with a due date tomorrow or before.
Tip. For your convenience, we've saved this configuration. You can download it, and import the views and dashboard to your data file in MLO.
To import views right-click in the Views pane → Import → Select the .mfv file.
To import a dashboard go to menu File → Import → Select the .xml file → Open → Select 'Dashboards'.